With a series of large hurricanes hitting the US recently, I wondered what impact their names have on people’s opinion of those names for their children: do people try avoid the new negative connotations of the name or is that even a factor in their decision process?
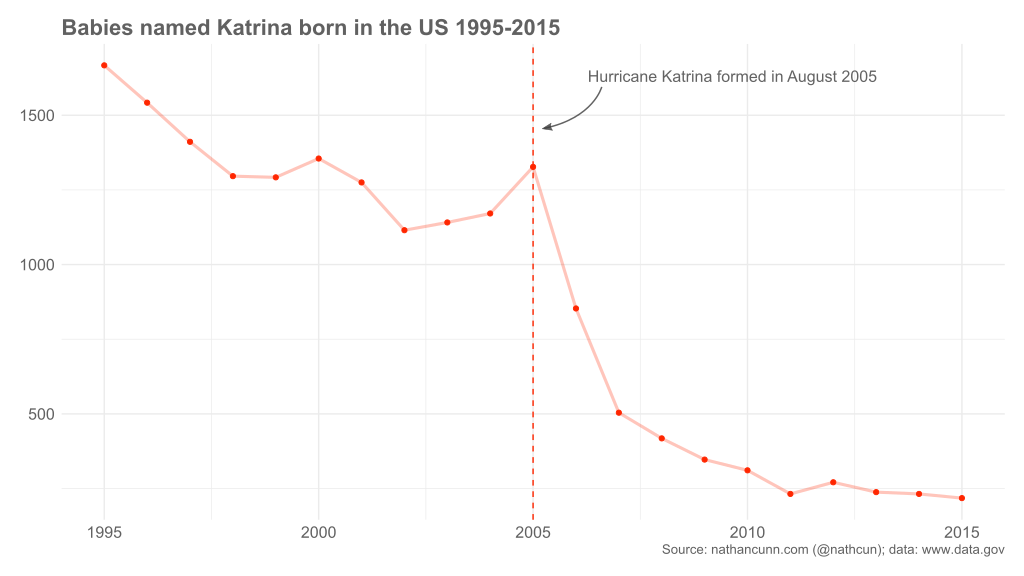
For some superficial exploration of this I looked at the single case of Hurricane Katrina because it had the useful combination of being both a hugely devastating hurricane and being given a reasonably common name. As you can see below, the name Katrina underwent a massive decrease in popularity in the years immediately following the hurricane, with a drop of just under 90% in girls named Katrina ten years after the hurricane, compared to ten years prior.
The data for this plot are all freely available on the site for the US government’s open data, specifically here. If you’d like to recreate this plot yourself you’ll need to download and unzip the data. The data come in individual files for each year from 1880-2016, listing the most popular names for boys and girls born in that year. Due to privacy restrictions, only names which were used at least five times in the specified year are included. The first step is to concatenate these datafiles into a single dataset, which we can do with the following R code.
setwd("/directory/containing/only/unzipped/data/")
names_files <- list.files()

for(file in names_files) {
  tmp <- read.csv(file, header = FALSE)
  # We need to create a year variable in the data
  tmp <- cbind(tmp, as.numeric(substr(file, start = nchar(file) - 7, nchar(file) - 3)))
  names(tmp) <- c("name", "sex", "count", "year")
  if(exists("names_dat")) {
    names_dat <- rbind(names_dat, tmp)
  } else {
    names_dat <- tmp
  }
}
With that done, plotting the data is straightforward using ggplot2. The annotated arrows were added after in Inkscape.
library(ggplot2)
year = 2005
name = "Katrina"
sex = "F"
ggplot(names_dat[names_dat$name == name & names_dat$sex == sex & names_dat$year %in% seq(year - 10, year + 10), ],
       aes(x = year, y = count)) +
       geom_line() +
       geom_vline(xintercept = 2005)